Similar figures that are the same shape but different size. Also, the ratios of the lengths of the corresponding sides are proportional. Knowing this, decide if the two figures pictured below are similar. Tell why or why not in your comment. Be sure to make ratios with corresponding sides!
Tuesday, January 27, 2009
Monday, January 26, 2009
Proportions
Use the following chart to create proportions and answer the questions.
1. How many cups of mix would it take to make 50 pancakes? Show the proportion on your comment.
2. How many cups of water would it take to make 20 pancakes? Show the proportion on your comment.
**Challenge** How many pancakes did I make if I used exactly 4 cups of water?
If you forget how to solve a proportion, follow this example by Harrison!
Sunday, January 25, 2009
Unit Rate Question
?Question, Question?
Be sure to label your answer specifically so it represents a unit rate.
Thursday, January 22, 2009
Equivalent Ratios
Equivalent Ratios-are ratios taht name the same compairson . You can find and equivalent ratio ratio by mutlplying or dividng both terms of a ratio of the same number.
Selena block 1
Wednesday, January 21, 2009
Unit Rates
Unit rates are helpful for finding the best deal on a product at a store. For example, a store may be selling fish food in a variety of brands. How do you know which brand is the best deal? Find the unit rate of each product and compare the answers!
Here we go! Brand A sells 3oz of fish food for $3.79. Brand B sells a similar kind at a price of $2.58 for 2oz. Is Brand A or Brand B a better deal?
Erin will tell you how to find the best deal using the unit rate!
divide 3.79 by 3 and you'll see that the unit cost is $1.26 an oz.( Brand A)
Divide 2.58 by 2, you get $1.29 an oz. (Brand B)
even though brand A costs more, it is a better deal per oz.!!!!!
Tuesday, January 20, 2009
Ratios and Snack Time
After completing some assignments for my Instructional Design class I decided I needed a snack. So, I went for a banana with peanut butter on it. While I was putting the p.b. on the banana I noticed something very interesting on the label. Check out the picture and see if you can find what was so interesting.
Can you think of/find anywhere else in the "real world" that ratios are used. Check out the web if you need to and post a comment with your findings!
Chapter 7 Introduction
We are now beginning Chapter 7, Proportional Relationships. This chapter covers ratios, rates, proportions, similar figures, and percent problems. This chapter is strong in the Number, Number Sense Standard with emphasis on Indicators 4, 5, 9, 14 and 15.
So what are ratios anyway? Ranika will tell you about them....read on:
A ratio compares two numbers. Ratios can be written in 3 ways.
EX: 5 to 7 5:7 and as a fraction 5/7.
n n n n t t n n
The ratio for n to t is 6:2, which can be reduced to 3:1.
RANIKA BLK 2
So what are ratios anyway? Ranika will tell you about them....read on:
A ratio compares two numbers. Ratios can be written in 3 ways.
EX: 5 to 7 5:7 and as a fraction 5/7.
n n n n t t n n
The ratio for n to t is 6:2, which can be reduced to 3:1.
RANIKA BLK 2
Wednesday, January 7, 2009
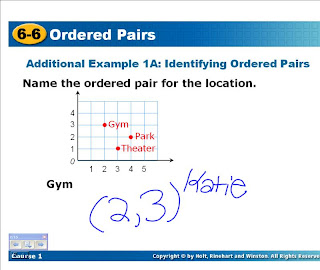
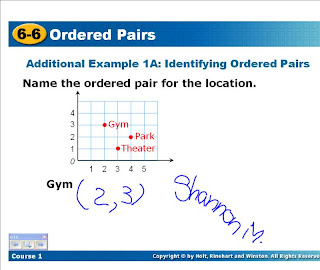
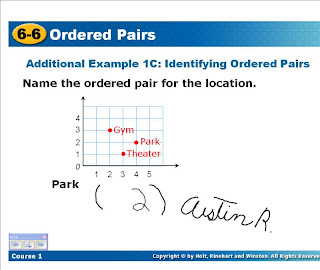
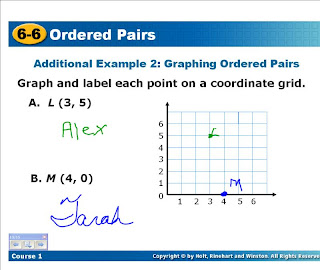
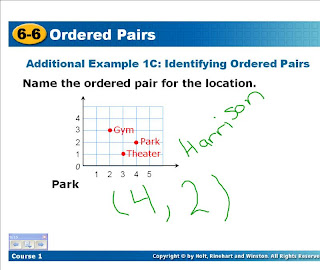
Ordered Pairs
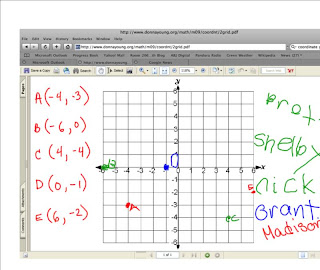
Ordered pairs (X,Y) are directions for plotting a point on a coordinate grid. They can both be positive, both negative, or a mixture of positive and negatives.
QUESTION: What quadrant would the ordered pair (-2, -8) fall in? Leave a comment with the answer!
Tuesday, January 6, 2009
Line Plot, Frequency Table, Histogram
Chapter 6 moves on into new types of graphs. Line plots and frequency tables are fairly easy to create while histograms require a bit more attention to detail. Histograms are quite similar to bar graphs but there are some differences. Can you tell me what makes a bar graph and a histogram different? Leave a comment with your answer!
Monday, January 5, 2009
Bar Graph
Winter Break is over, so to introduce bar graphs we conducted a survey of gifts students recieved. We picked four categories that seemed to capture the most popular gifts. Here are the results. Also, today was nice becuase every student was able to use the AirLiner in one class setting, which is unusual. Each student was given the chance to put a tally mark next to the gift/s that they recieved. When all students recorded their results we had one student create a bar graph to display the data.
A very nice bar graph! Title, lables and appropriate intervals on the scale.
Subscribe to:
Posts (Atom)